Cohort Analysis
VarLens supports aggregating variants across multiple cases for cohort-level analysis.
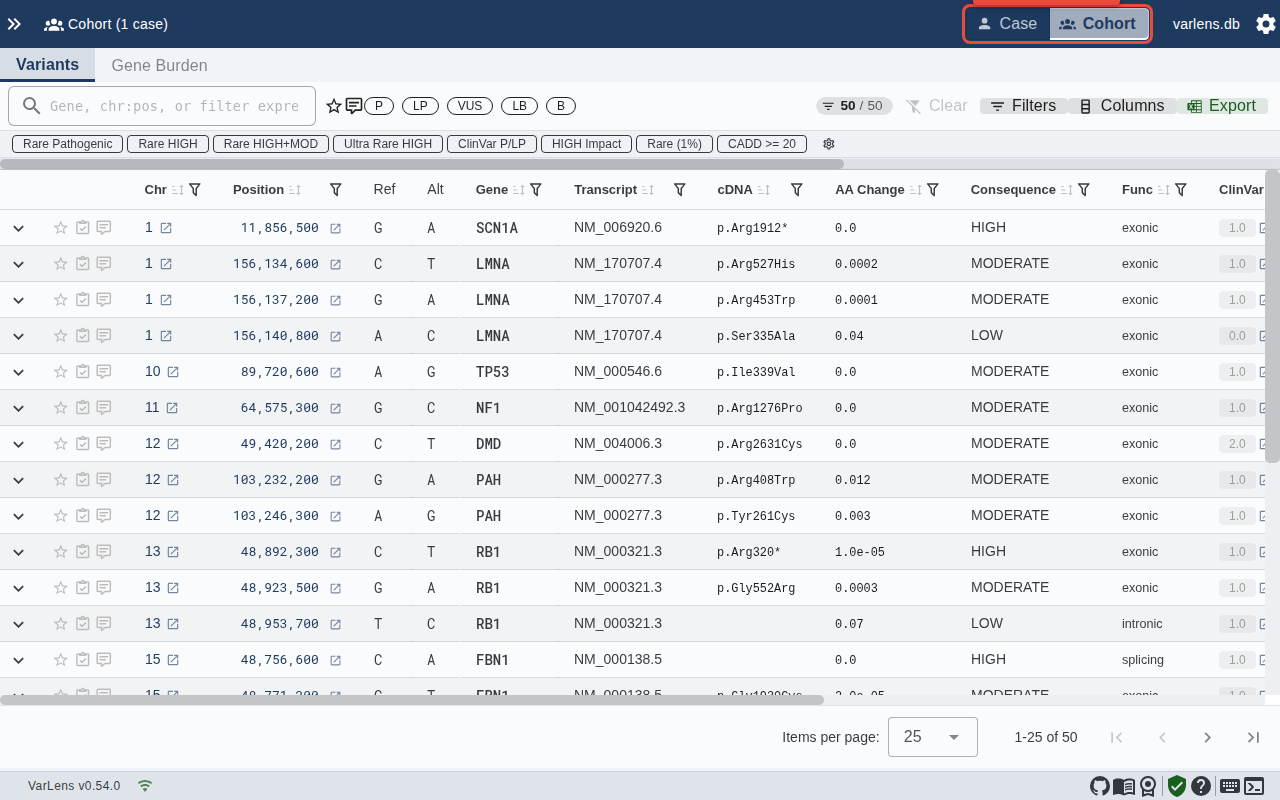
Switching to Cohort Mode
Use the mode toggle in the toolbar to switch between Case and Cohort views. Cohort mode aggregates all imported cases into a single table view.
Cohort Table
The cohort table shows:
- Carrier count — Number of cases carrying each variant
- Homozygous count — Cases with homozygous genotype
- Affected carriers — Carriers with affected status
- All standard variant columns (gene, consequence, scores, etc.)
Gene Burden Analysis
VarLens includes gene burden testing to identify genes with statistically significant variant enrichment:
- Fisher's exact test — p-value, odds ratio, and 95% confidence interval
- Logistic burden test — p-value and beta coefficient
- FDR-adjusted q-values for multiple testing correction
- Volcano plot and Manhattan plot visualizations of results
Filtering
Cohort view supports the same filtering capabilities as case view, plus additional cohort-specific filters for carrier count thresholds.