App Layout
VarLens has a clean, functional layout with five main areas. This page explains what each part of the interface does.
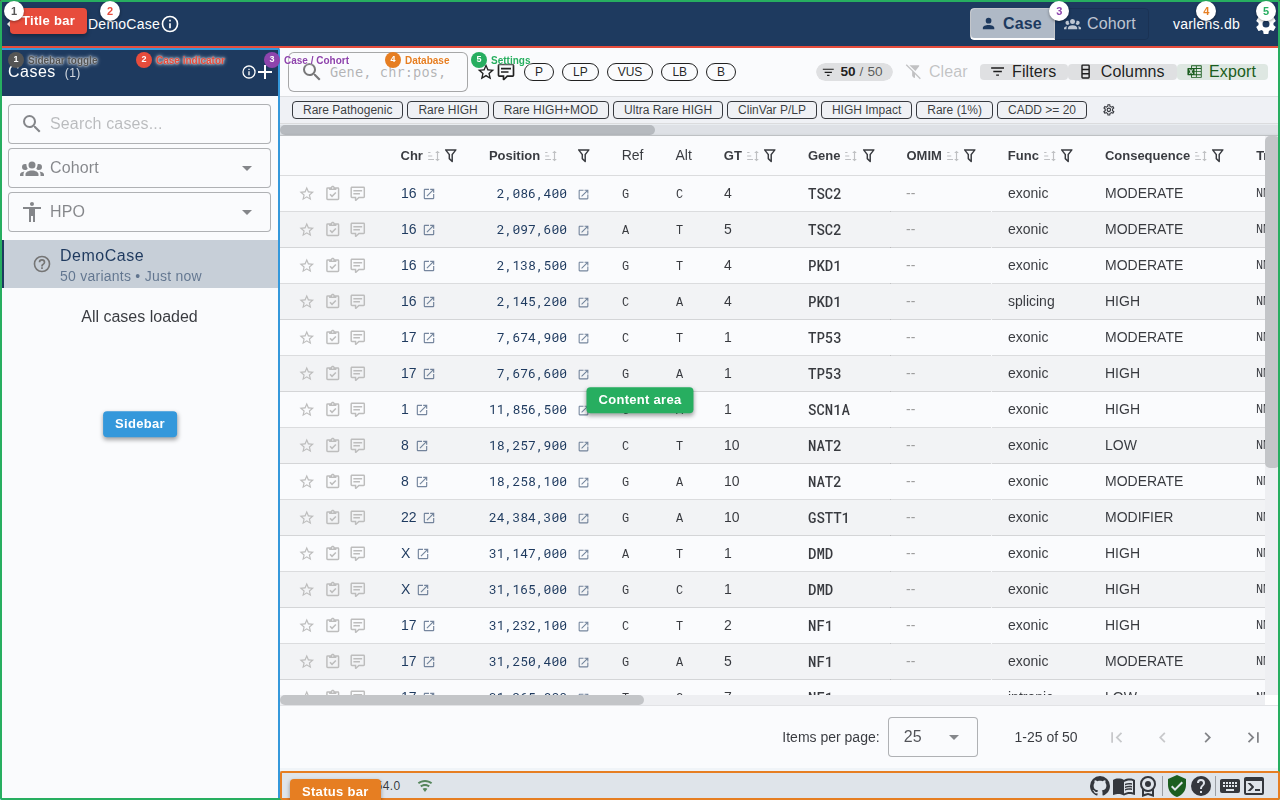
Title Bar (Top)
The top bar provides navigation and context at a glance (numbers match the callouts in the screenshot):
| # | Element | Description |
|---|---|---|
| 1 | Sidebar toggle | Collapse or expand the case list sidebar |
| 2 | Case indicator | Shows the active case name and status icons — click to open case metadata |
| 3 | Case / Cohort toggle | Switch between single-case and cohort analysis modes |
| 4 | Database picker | Shows the current database file; click to switch or create databases |
| 5 | Settings gear | Access Database Overview, External Links, Custom Tags, and reset options |
Click the VarLens title text to return to the home screen.
Sidebar (Left)
The sidebar lists all imported cases. Click a case to load its variants into the table. The sidebar is resizable by dragging its right edge, and can be collapsed with the toggle button.
- + button — Import new cases (single file, multiple files, folder, or ZIP)
- Case list — Each entry shows the case name; right-click for context menu
- Search — Filter cases by name
Content Area (Center)
The main content area displays either the Variant Table (in Case mode) or the Cohort Table (in Cohort mode). Above the table sits the filter toolbar with search, quick filters, and action buttons.
Detail Panels (Right)
Clicking a table row opens the Variant Details Panel as a slide-in drawer from the right. The Filter Drawer also opens from the right when you click the Filters button.
Status Bar (Bottom)

The status bar at the bottom provides information and quick links:
| Icon | Description |
|---|---|
| VarLens vX.X.X | Current version (click for detailed version info) |
| Wi-Fi icon | Network status — green when online (API enrichment available), grey when offline |
| GitHub icon | Open the VarLens GitHub repository |
| License icon | View the MIT license |
| Shield icon | Disclaimer status — green check when acknowledged |
| ? icon | Open the FAQ |
| Console icon | Toggle the log viewer (badge shows error count) |