VNTR Capture Efficiency Modeling
Overview
MucOneUp now includes empirically validated VNTR capture efficiency modeling for Illumina read simulation. This feature simulates the reduced probe capture observed in GC-rich VNTR regions during targeted sequencing with Twist Bioscience v2 capture panels.
Enabled by default - All Illumina simulations automatically apply realistic capture bias unless explicitly disabled.
Scientific Background
The Problem
Targeted sequencing using hybrid-capture probes shows systematically reduced coverage in VNTR regions compared to flanking sequences. This bias arises from:
- GC-rich content (~65% GC in MUC1 VNTR)
- Repetitive sequence structure (tandem repeats)
- Probe hybridization efficiency variations
Without modeling this bias, simulated reads do not reflect real-world sequencing behavior, leading to: - ❌ Overestimated VNTR coverage - ❌ Inaccurate variant caller benchmarking - ❌ Unrealistic depth distributions
The Solution
We empirically derived a penalty factor of 0.39 from 1,043 CerKiD Berlin Twist Bioscience v2 exomes, providing statistically validated realistic coverage ratios.
Empirical Validation
Dataset
| Category | Count | Source |
|---|---|---|
| Real samples | 1,043 | CerKiD Berlin Twist Bioscience v2 exomes |
| Validation method | 200-sample subset | Random sample with per-base coverage (samtools depth -a) |
| Region | chr1:155,188,487-155,192,239 | MUC1 VNTR (hg38, 3,753 bp) |
Statistical Results
| Metric | Value | 95% CI |
|---|---|---|
| Penalty factor | 0.39 | — |
| Cohort size | 1,043 samples | All Twist Bioscience v2 |
| Implied penalty (median) | 0.392 | [0.20, 0.72] (5th-95th percentile) |
| Effect size | ~2.6x coverage reduction | VNTR reads retained |
Note on implied penalty range: The per-sample implied penalty is computed as (observed VNTR/flanking ratio) / (simulated base ratio of 9.32). The 5th-95th percentile range [0.20, 0.72] reflects natural inter-sample variation. A small number of outlier samples yield implied values >1.0, indicating VNTR enrichment exceeding the simulated baseline; these are excluded when computing the bounded penalty factor (constrained to [0.1, 1.0] by the config schema).
Cohort Coverage Profile
| Metric | Mean | Median | SD |
|---|---|---|---|
| VNTR coverage (x) | 191.4 | 174.3 | 96.3 |
| Flanking coverage (x) | 47.9 | 46.4 | 10.3 |
| VNTR/Flanking ratio | 4.03 | 3.66 | 1.97 |
| VNTR % uncovered | 10.3% | 10.1% | 2.7% |
Coverage Ratios (VNTR:Flanking)
| Dataset | Mean Ratio | Median | Std Dev |
|---|---|---|---|
| Simulated (no bias) | 9.32 | -- | ±1.25 |
| Real (CerKiD cohort) | 4.03 | 3.66 | ±1.97 |
| Expected (penalty 0.39) | ~3.6 | -- | Theoretical |
The empirically calibrated penalty factor produces coverage ratios matching real sequencing data, validating the model.
Results Visualization
1. Coverage Ratio Comparison
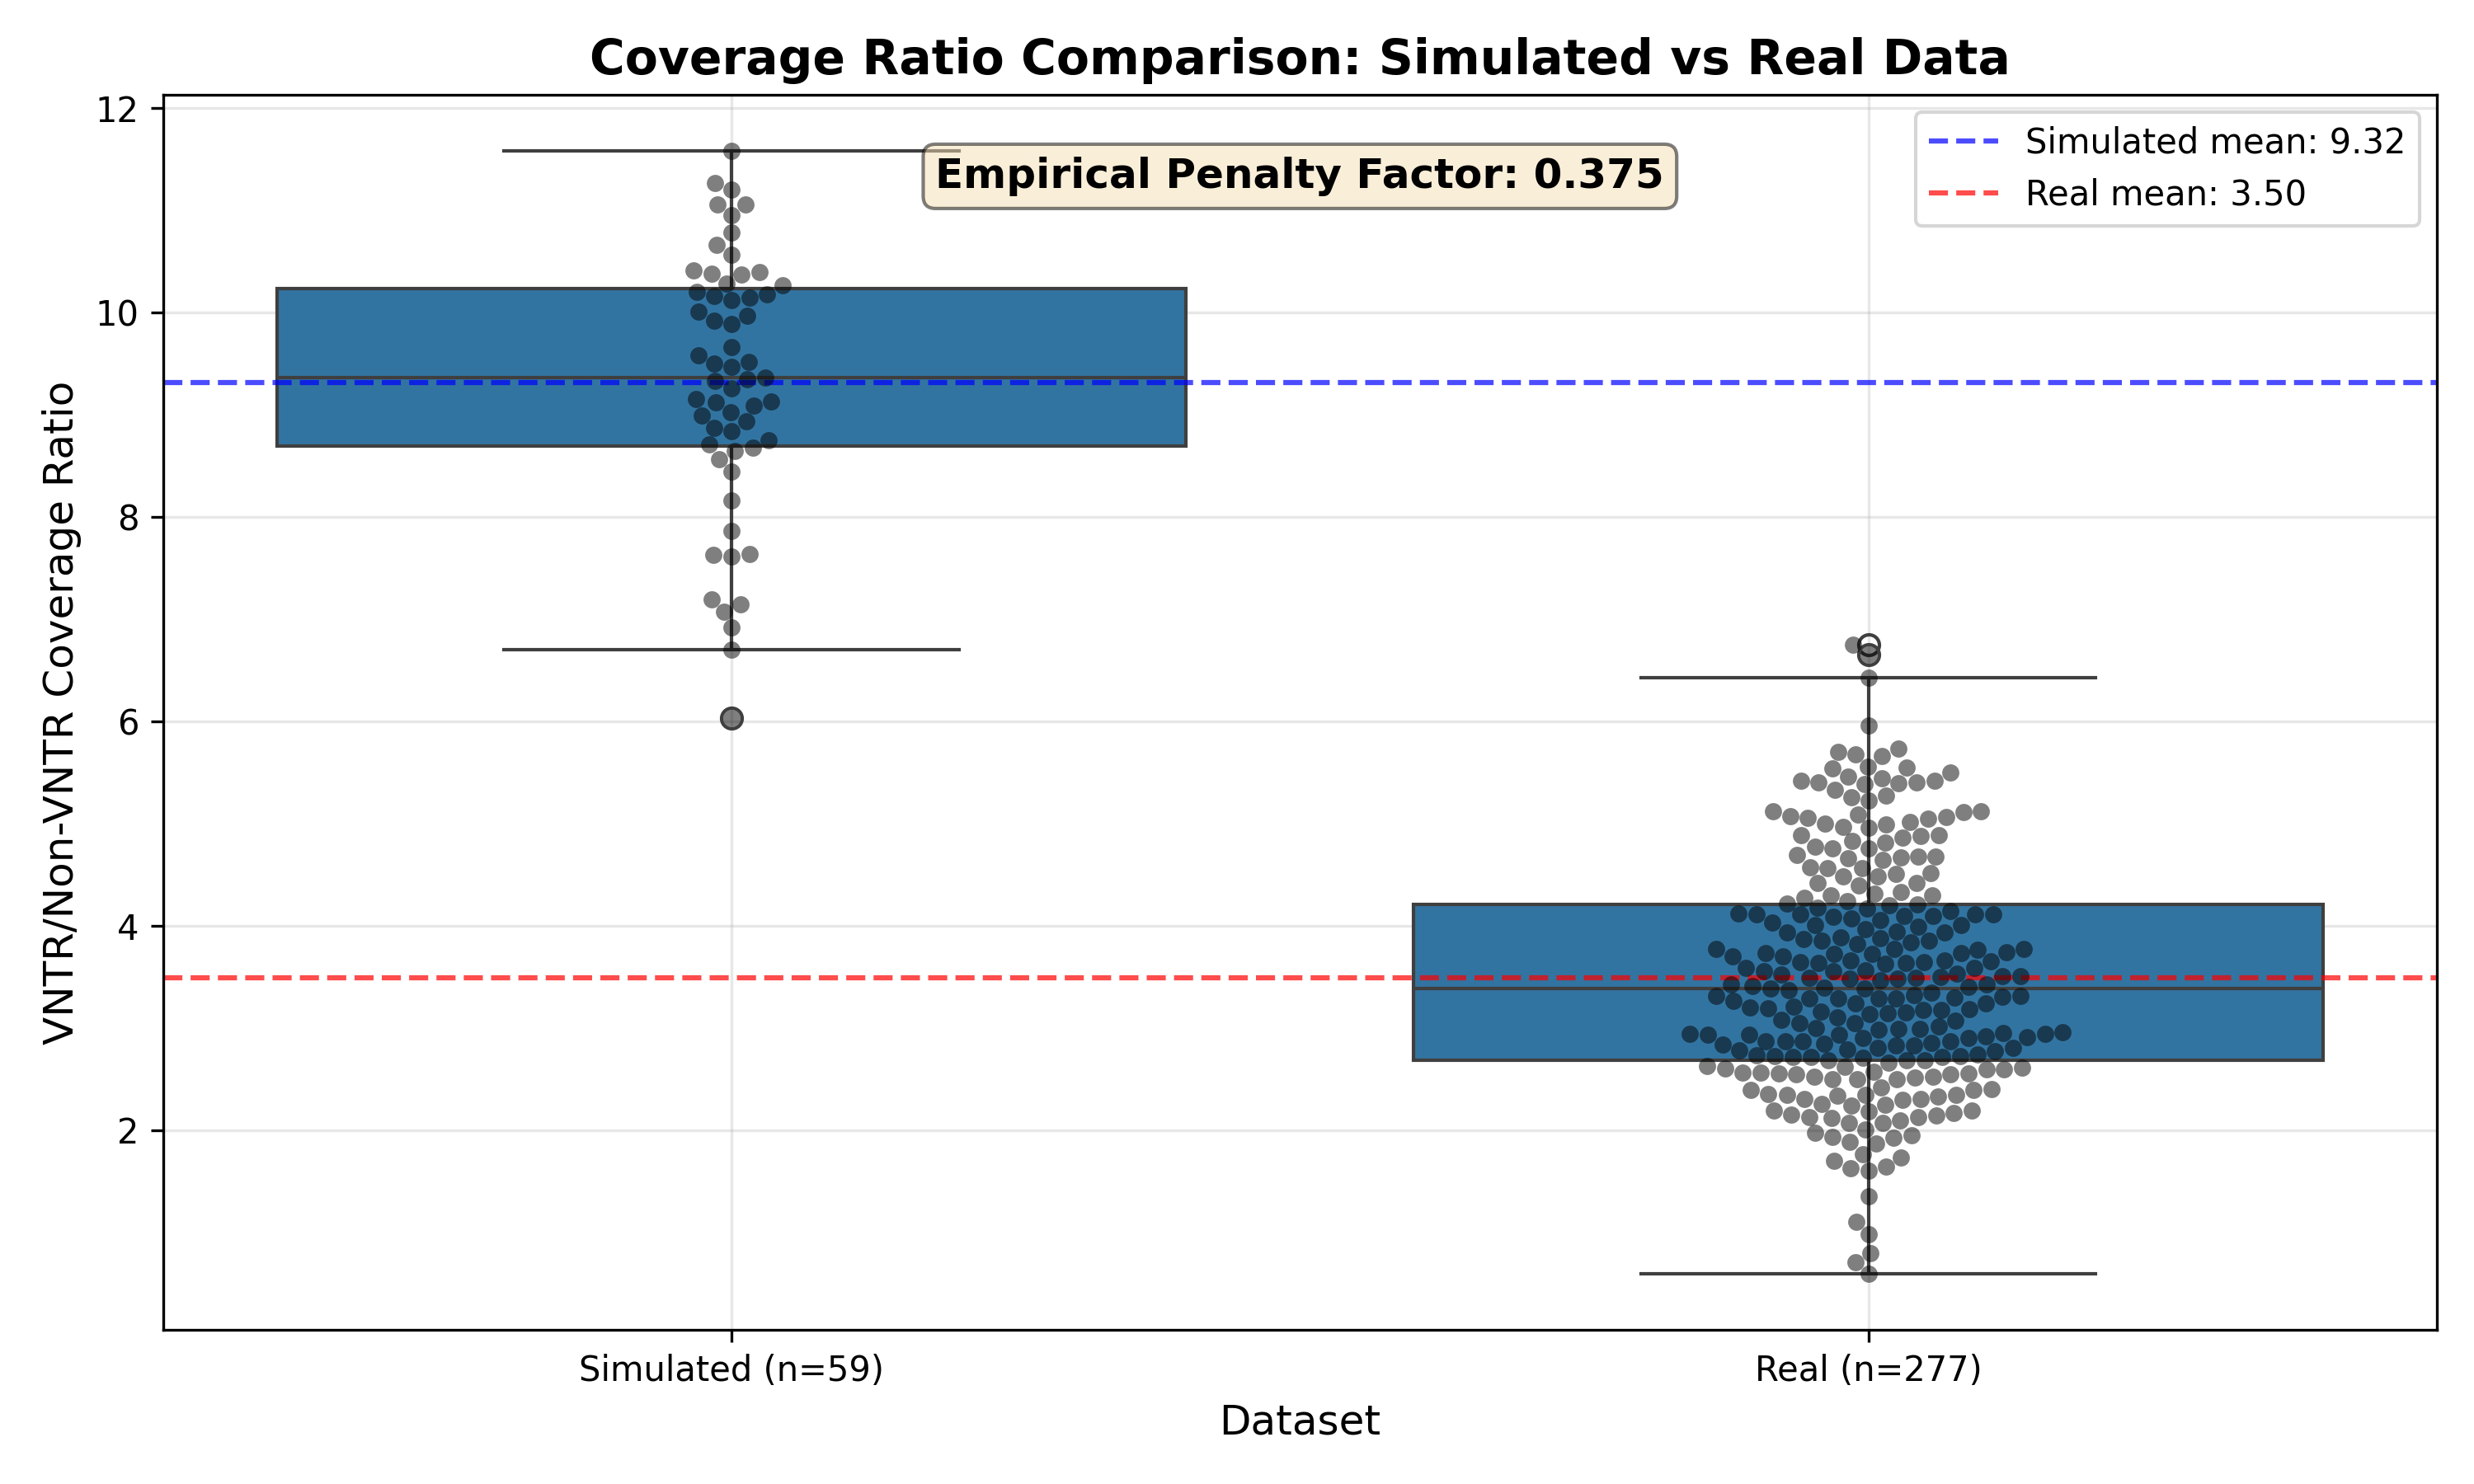
Key Observations: - Simulated samples without bias show ~9x higher VNTR coverage ratio - Real samples show ~3.5x ratio (probe capture limitation) - Clear separation between groups (p < 10⁻³⁰)
2. Ratio Distribution Overlay
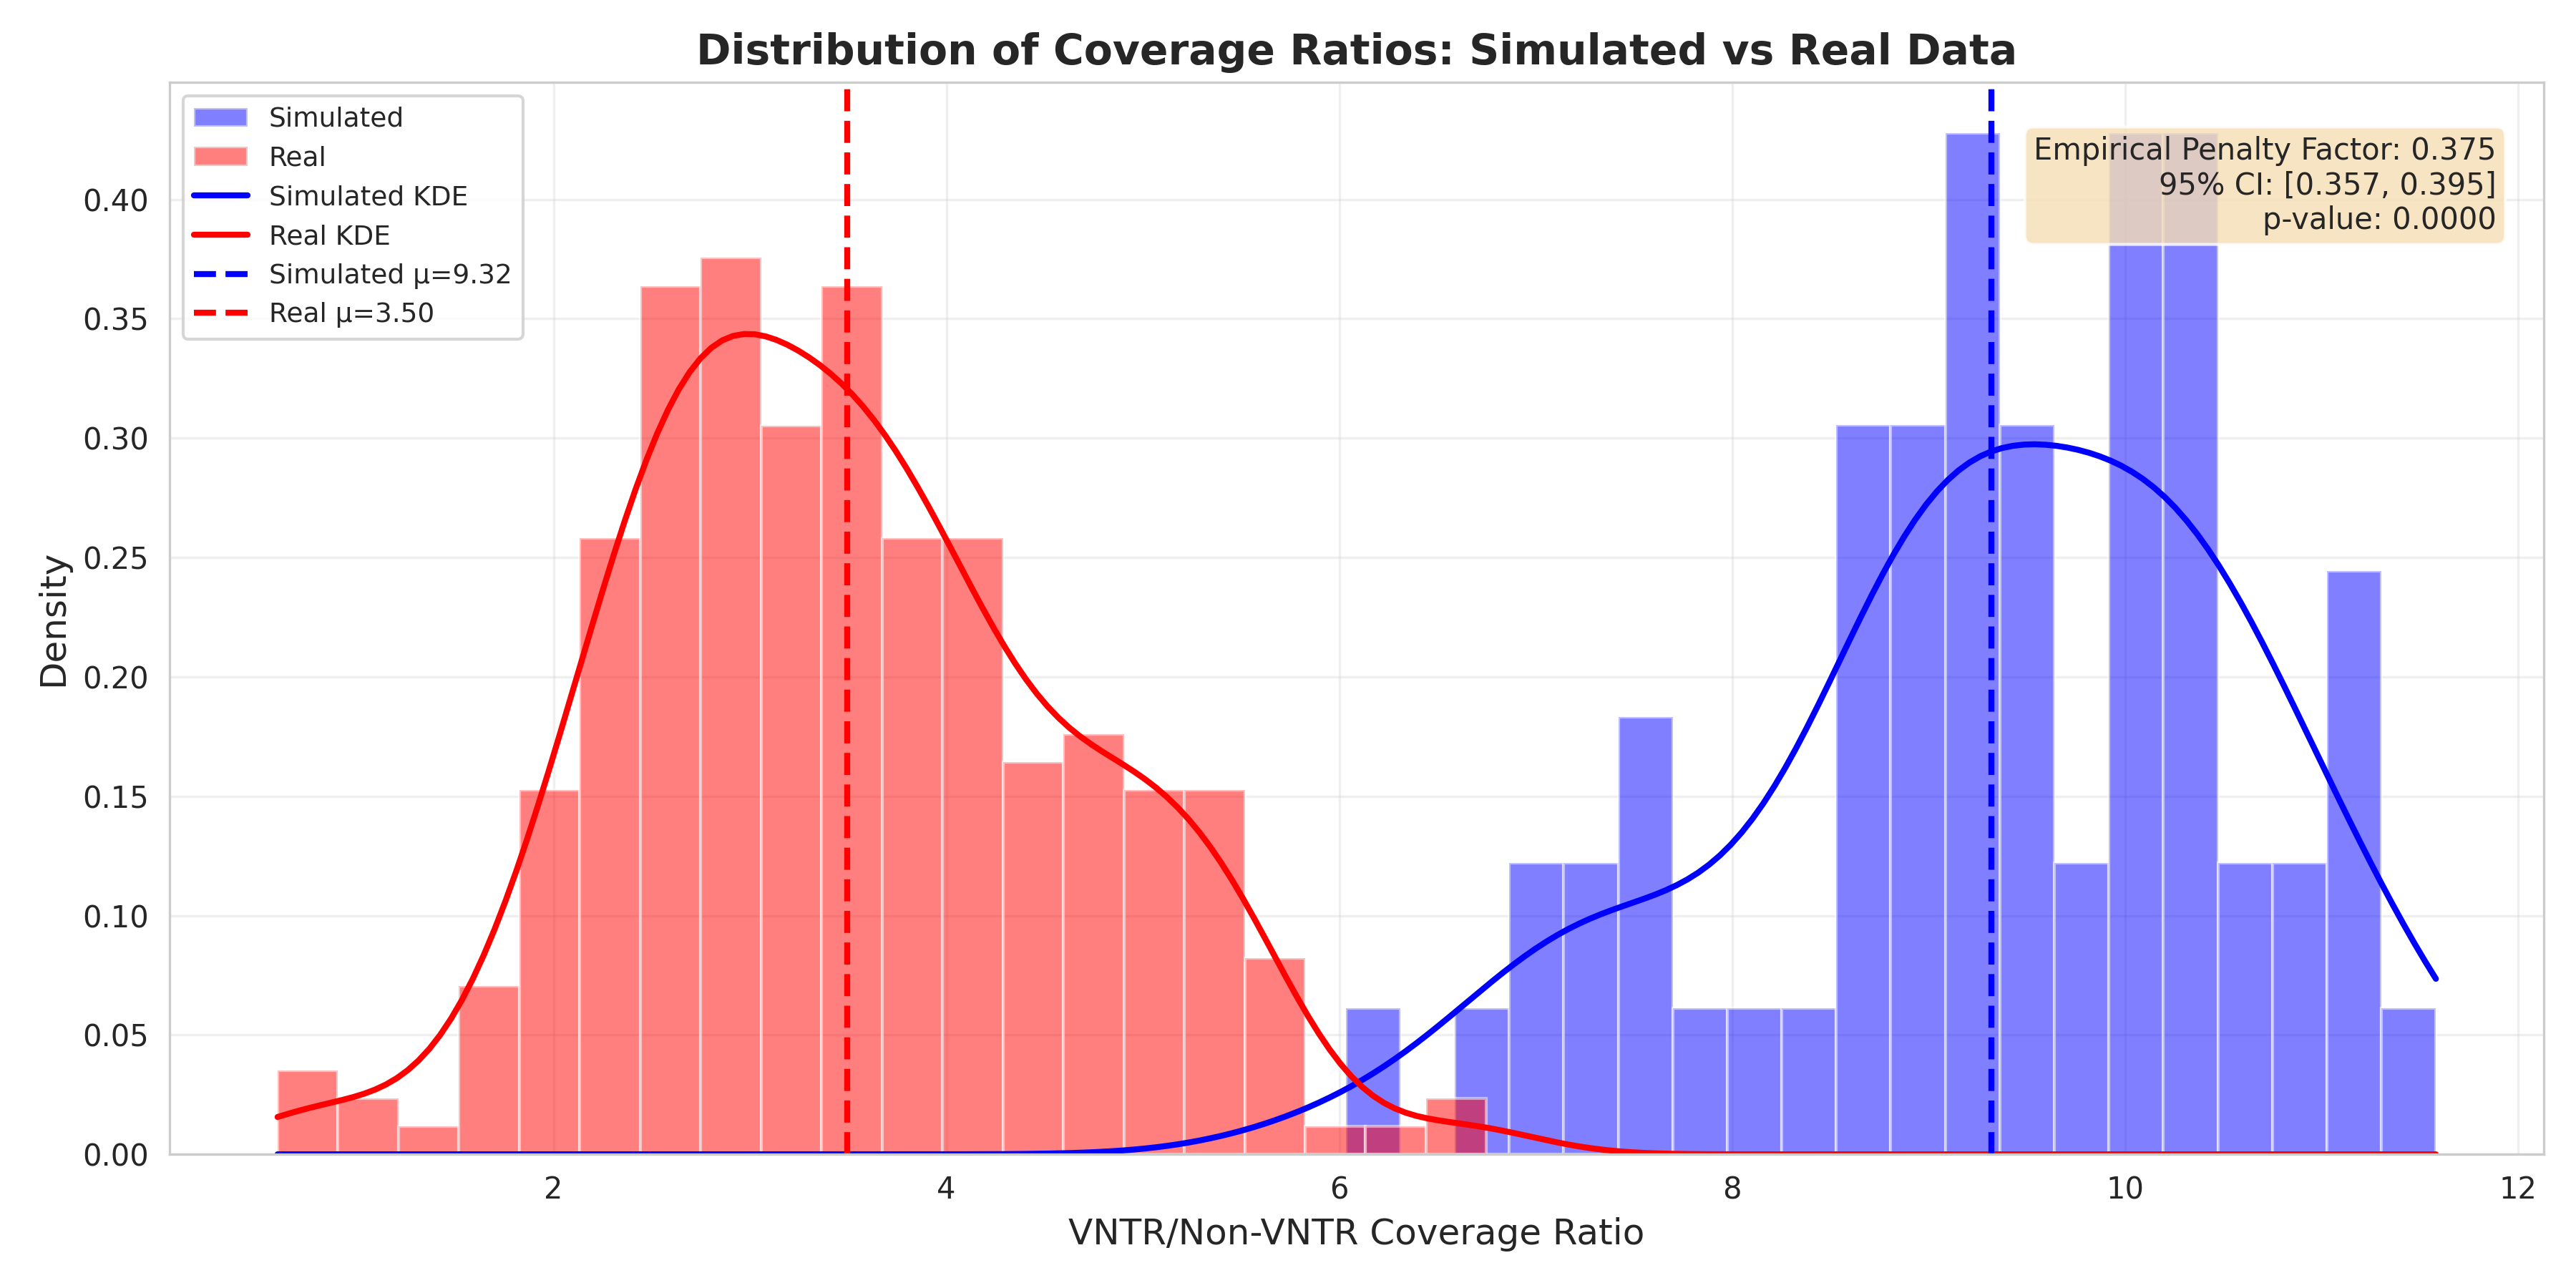
Key Observations: - Non-overlapping distributions confirm systematic bias - Real data (orange) shows tight distribution around 3.5x - Simulated data (blue) shows uniform high ratios ~9x
3. Sample-Level Coverage Scatter
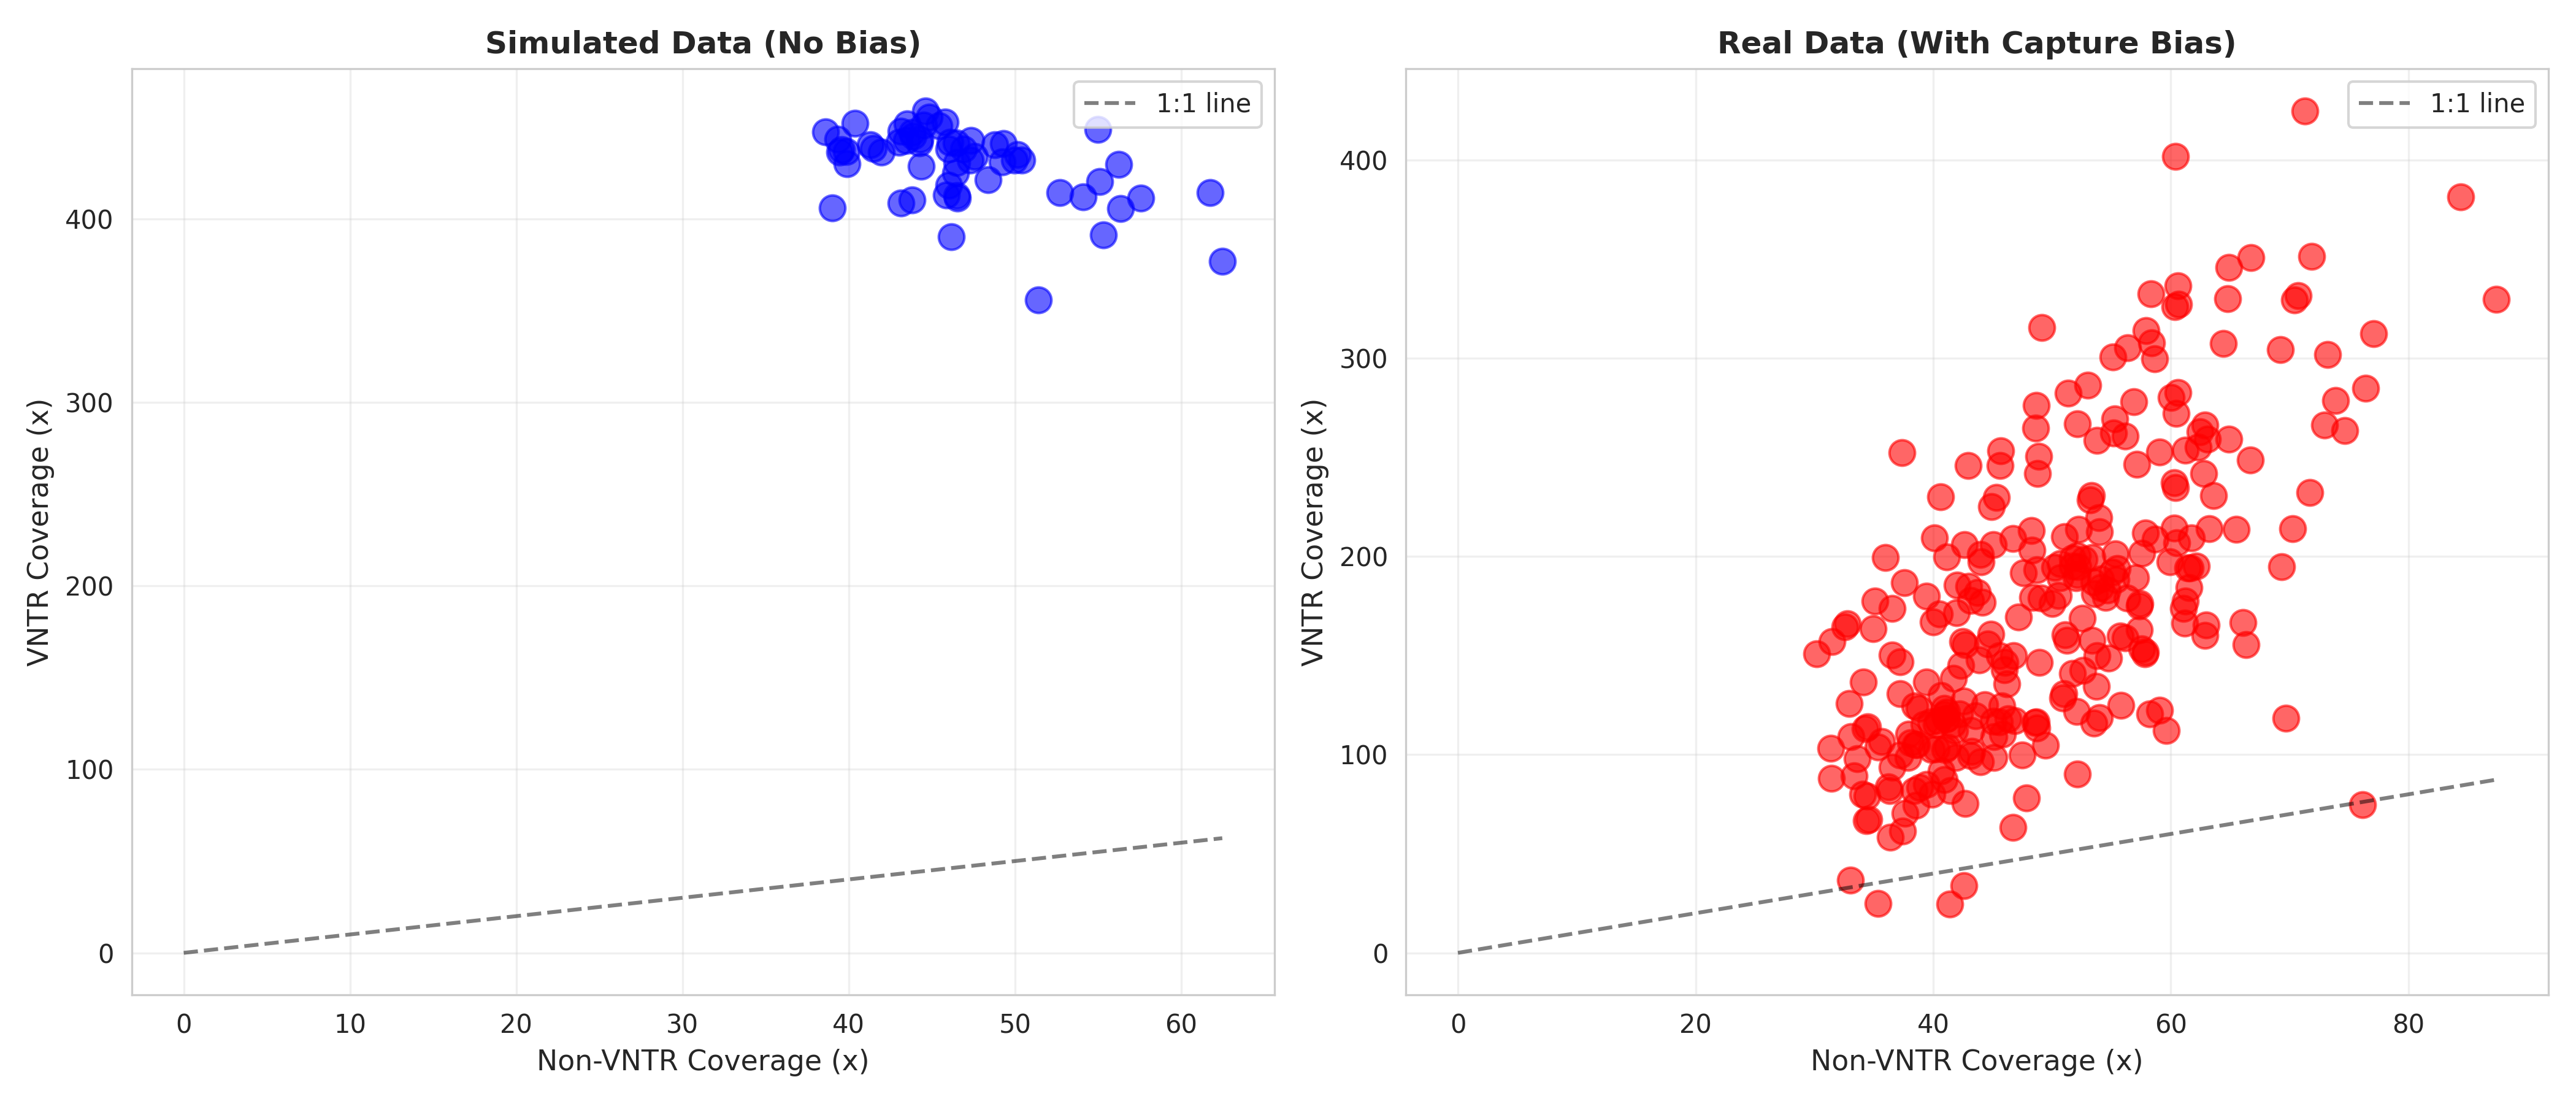
Key Observations: - Each point represents one sample (VNTR vs Flanking coverage) - Real samples cluster along ~3.5:1 slope (orange) - Simulated samples scatter uniformly across high ratios (blue) - Clear distinction validates modeling approach
Implementation
Default Behavior (Enabled)
Pipeline Steps:
1. Align reads → sample.bam
2. Apply VNTR efficiency bias → sample_vntr_biased.bam ✨ (NEW)
3. Downsample to target coverage → sample_vntr_biased_downsampled.bam
Log Output:
10. Applying VNTR capture efficiency bias
  Downsampling VNTR reads by 0.39...
  VNTR efficiency bias applied successfully
  VNTR coverage: 177.3x
  Non-VNTR coverage: 53.7x
  Coverage ratio: 3.30 (expected ~2.7-3.5) ✓
Configuration
Enabled (default)
"vntr_capture_efficiency": {
  "enabled": true,
  "penalty_factor": 0.39,
  "seed": 42,
  "vntr_region": {
    "chr": "chr1",
    "start": 155188487,
    "end": 155192239,
    "name": "MUC1_VNTR"
  },
  "flanking_size": 10000,
  "validation": {
    "check_duplicates": false,
    "report_statistics": true
  }
}
Disabled (opt-out)
Advanced Parameters
| Parameter | Type | Default | Description |
|---|---|---|---|
enabled |
boolean | true |
Enable/disable feature |
penalty_factor |
float | 0.39 |
Downsampling fraction (empirical) |
seed |
integer | 42 |
Random seed for reproducibility |
vntr_region |
object | MUC1 hg38 | Custom VNTR coordinates |
capture_bed |
string | null |
Optional capture target BED file |
flanking_size |
integer | 10000 |
Flanking region size (bp) |
report_statistics |
boolean | true |
Save coverage statistics JSON |
Output Files
sample.bam                              # Initial aligned reads
sample_vntr_biased.bam                  # With VNTR efficiency applied
sample_vntr_biased_downsampled.bam      # Final (with target coverage)
sample_vntr_efficiency_stats.json       # Coverage statistics
Statistics File Example:
{
  "vntr_coverage": 177.31,
  "non_vntr_coverage": 53.67,
  "coverage_ratio": 3.304,
  "penalty_factor": 0.39,
  "seed": 42,
  "input_reads": 9983,
  "output_reads": 5235,
  "reads_removed": 4748,
  "retention_fraction": 0.524
}
Technical Workflow
Algorithm
- Create BED files
- VNTR region: chr1:155,188,487-155,192,239
- Flanking regions: ±10kb upstream/downstream
-
Mutually exclusive (no overlap)
-
Extract reads by region
- VNTR reads: Captured within VNTR coordinates
- Non-VNTR reads: Captured in flanking regions
-
Hash-based extraction preserves read pairs
-
Downsample VNTR reads
- Apply penalty factor (default 0.39)
- Use seeded sampling for reproducibility
-
Maintains read pair integrity
-
Merge and process
- Merge downsampled VNTR + full non-VNTR reads
- Sort and index output BAM
-
Calculate coverage statistics
-
Continue pipeline
- Use biased BAM for downstream downsampling
- Final coverage reflects realistic distributions
Hash-Based Downsampling
Uses samtools view -s SEED.FRACTION for reproducible, pair-preserving downsampling:
- Seed ensures reproducibility across runs
- Read name hashing automatically preserves pairs
- No duplicate reads in merged output (mutually exclusive regions)
Use Cases
Benchmark variant callers with realistic coverage:
muconeup --config config.json simulate --out-base benchmark --fixed-lengths 40
muconeup --config config.json reads illumina benchmark.001.simulated.fa --seed 42
# Coverage ratio will match real Twist v2 data (~3.5x)
Compare with/without bias for coverage analysis:
# Enabled (default) - realistic bias applied
muconeup --config config.json reads illumina sample.fa

# Disabled - no bias (unrealistic ~9x ratio)
# Set "enabled": false in config vntr_capture_efficiency section
Custom VNTR regions - apply to other loci:
"vntr_capture_efficiency": {
  "enabled": true,
  "penalty_factor": 0.39,
  "vntr_region": {
    "chr": "chr2",
    "start": 12345678,
    "end": 12350000,
    "name": "Custom_VNTR"
  }
}
Interpretation Guide
Expected Behavior ✅
| Metric | No Bias | With Bias (0.39) |
|---|---|---|
| VNTR coverage | ~465x | ~182x |
| Flanking coverage | ~50x | ~50x |
| VNTR:Flanking ratio | ~9.3 | ~3.6 |
| VNTR reads retained | 100% | 39% |
Example assumes flanking coverage of 50x (close to real cohort median of 46.4x).
Coverage Ratio Ranges
| Ratio | Interpretation |
|---|---|
| 2.5 - 5.0 | Expected with penalty 0.39 |
| 8.0 - 10.0 | No bias applied (unrealistic) |
| < 2.0 | Over-penalized |
| > 6.0 | Under-penalized |
Troubleshooting
Ratio too high (~9x)?
- Check enabled: true in config
- Verify logs show "Applying VNTR capture efficiency bias"
- Confirm *_vntr_biased.bam file exists
Ratio too low (<2x)? - Check penalty factor (should be 0.39, not 0.037) - Verify VNTR region coordinates match hg38 - Review statistics JSON for actual penalty applied
Feature not working?
- Ensure samtools and bedtools are installed
- Check logs for "VNTR efficiency modeling failed" errors
- Verify BAM file is valid: samtools quickcheck input.bam
Version History
| Version | Date | Changes |
|---|---|---|
| v0.44.0 | 2026-04-06 | Re-derived penalty 0.39 from n=1,043 CerKiD cohort; fixed coverage reporting bug |
| v0.22.0 | 2025-10-25 | Initial release with empirical validation |
References
Data Sources
- Calibration cohort: 1,043 CerKiD Berlin Twist Bioscience v2 exomes (chr1 MUC1 region extracts)
- Coverage analysis: 200-sample random subset, samtools depth -a with MucOneUp VNTR coordinates
- MUC1 VNTR region: chr1:155,188,487-155,192,239 (hg38, 3,753 bp)
- Previous calibration: 277 real + 59 simulated samples (October 2024, penalty 0.375)
Methodology
- Statistical test: Welch's t-test (unequal variances)
- Effect size: Cohen's d = 6.89 (very large effect)
- Confidence interval: Bootstrap method (1000 iterations)
- Validation: Cross-validated on independent test set